How Can We Help?
Open Street Map (Vector Data)
Open Street Map (“OSM”) is a great resource. It’s a worldwide online map of GIS vector data. It’s relatively accurate, you can use it for any application, and best of all, it’s free. It’s created by volunteer contributors, who spend their time digitising and classifying roads, railways, power lines, buildings, coasts, rivers, lakes, forests, grass areas, and much more besides. If you don’t have anything else and don’t want to pay for commercial sources, we find it gives really good results with TerraForm.
GETTING OSM DATA
OSM data is available from a number of sources. You can download small sections of it (or the whole world) directly from https://openstreetmap.org, or you can download larger chunks from one of their partners, who break it up into countries (and sometimes smaller regions), such as https://download.geofabrik.de/. But we found the best way to get exactly what we want is to use a plugin for QGIS called Quick OSM.
Another really useful data plugin for QGIS is Quick Map Services, which provides links to load lots of online imagery, raster maps, and various other background data sources.
WE NEED
Quick OSM is a plugin for QGIS (open source GIS software), so we need QGIS:
You can get QGIS here: https://qgis.org. We’re using version 3.14 in this tutorial.
INSTALLING PLUGINS
Step 1
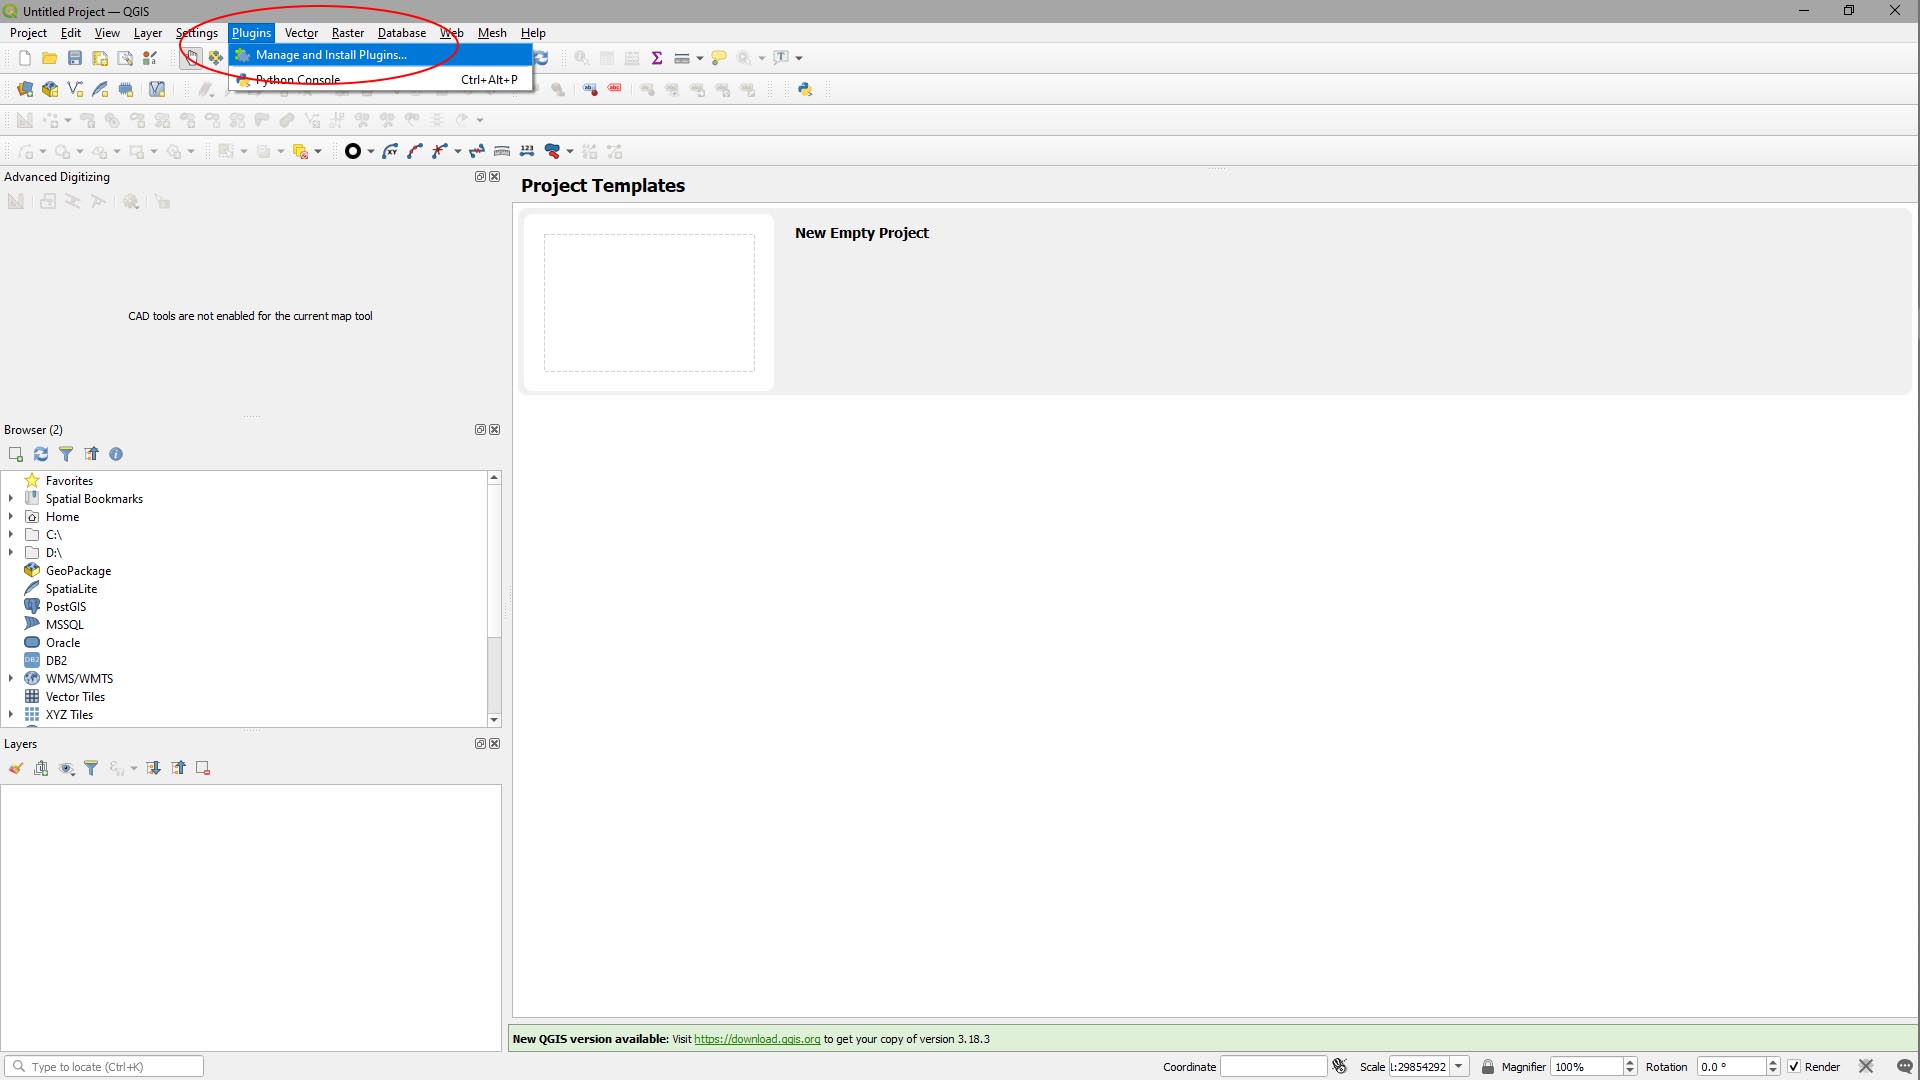
- Launch QGIS and click Plugins > Manage & Install Plugins… from the main menu.
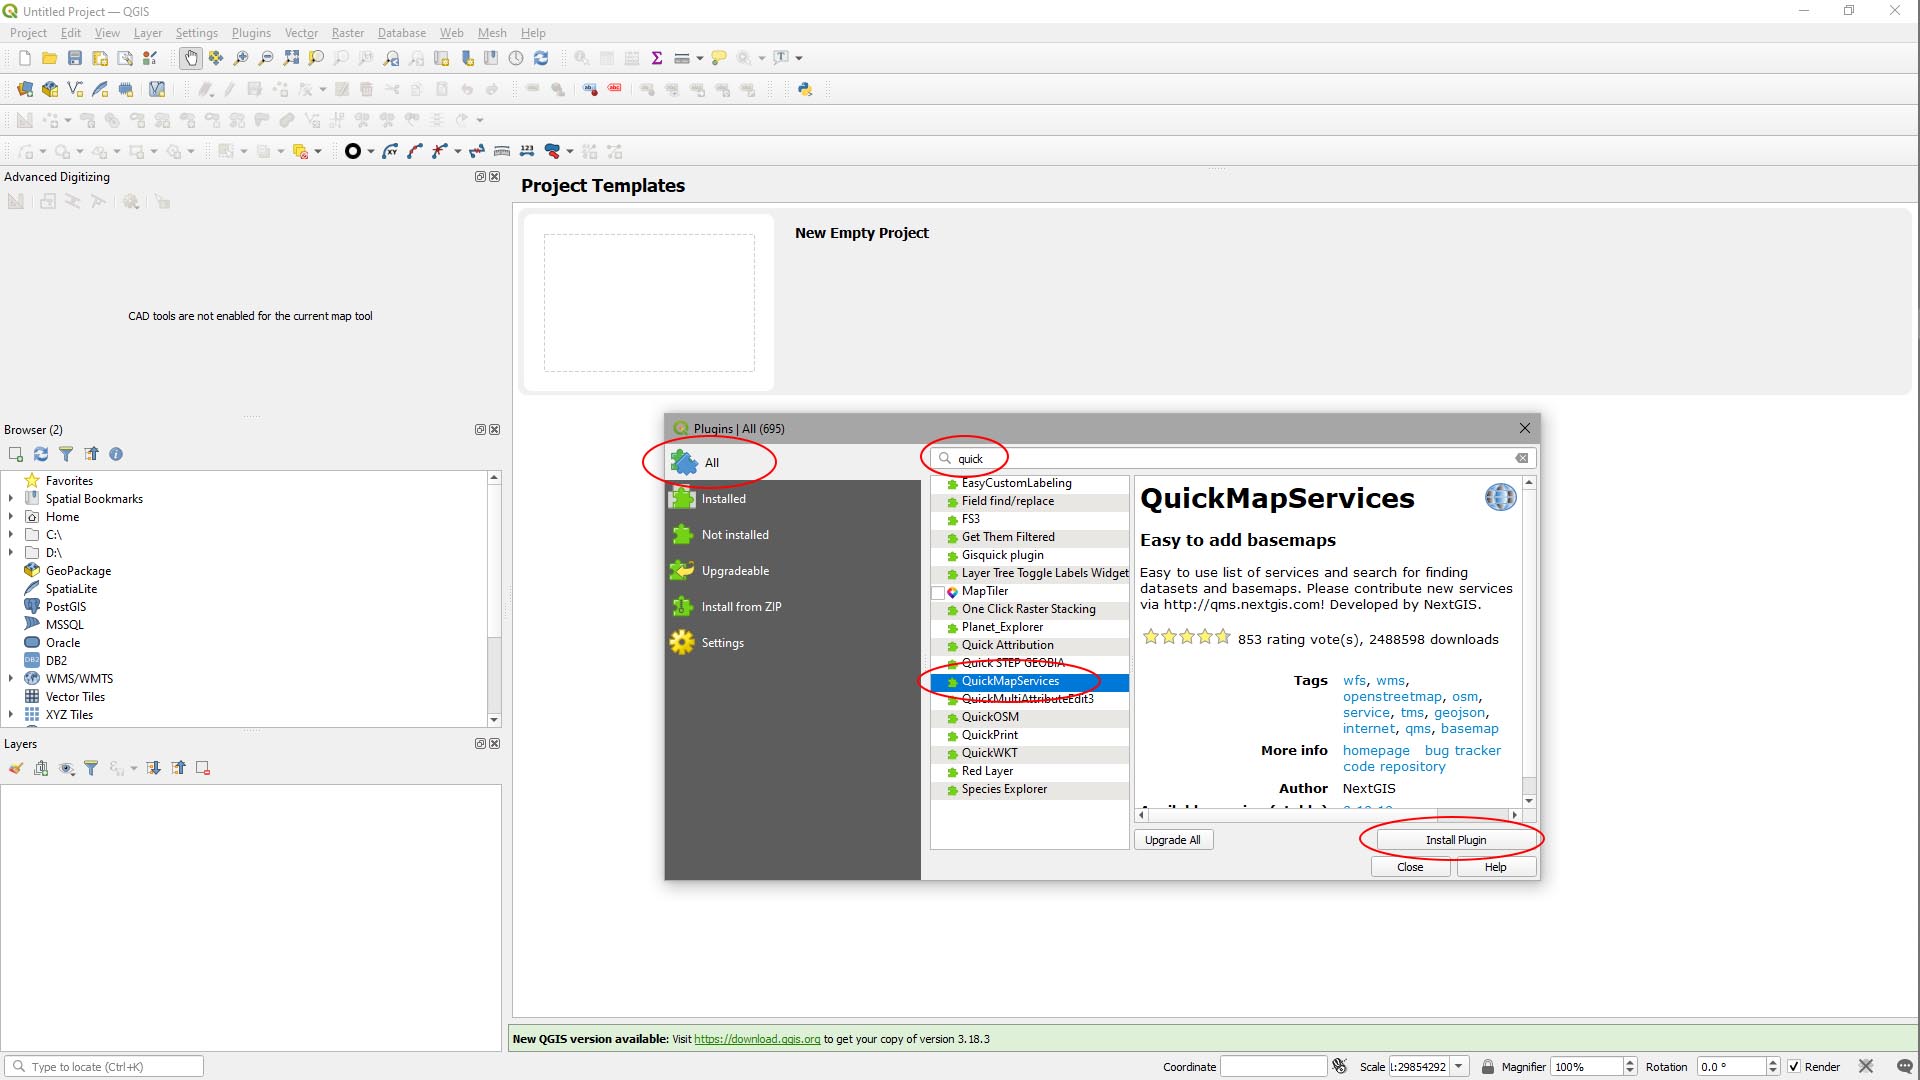
- In the Plugins window that appears, select the All tab and type ‘quick’ in the search bar, select QuickMapServices, then Install Plugin.
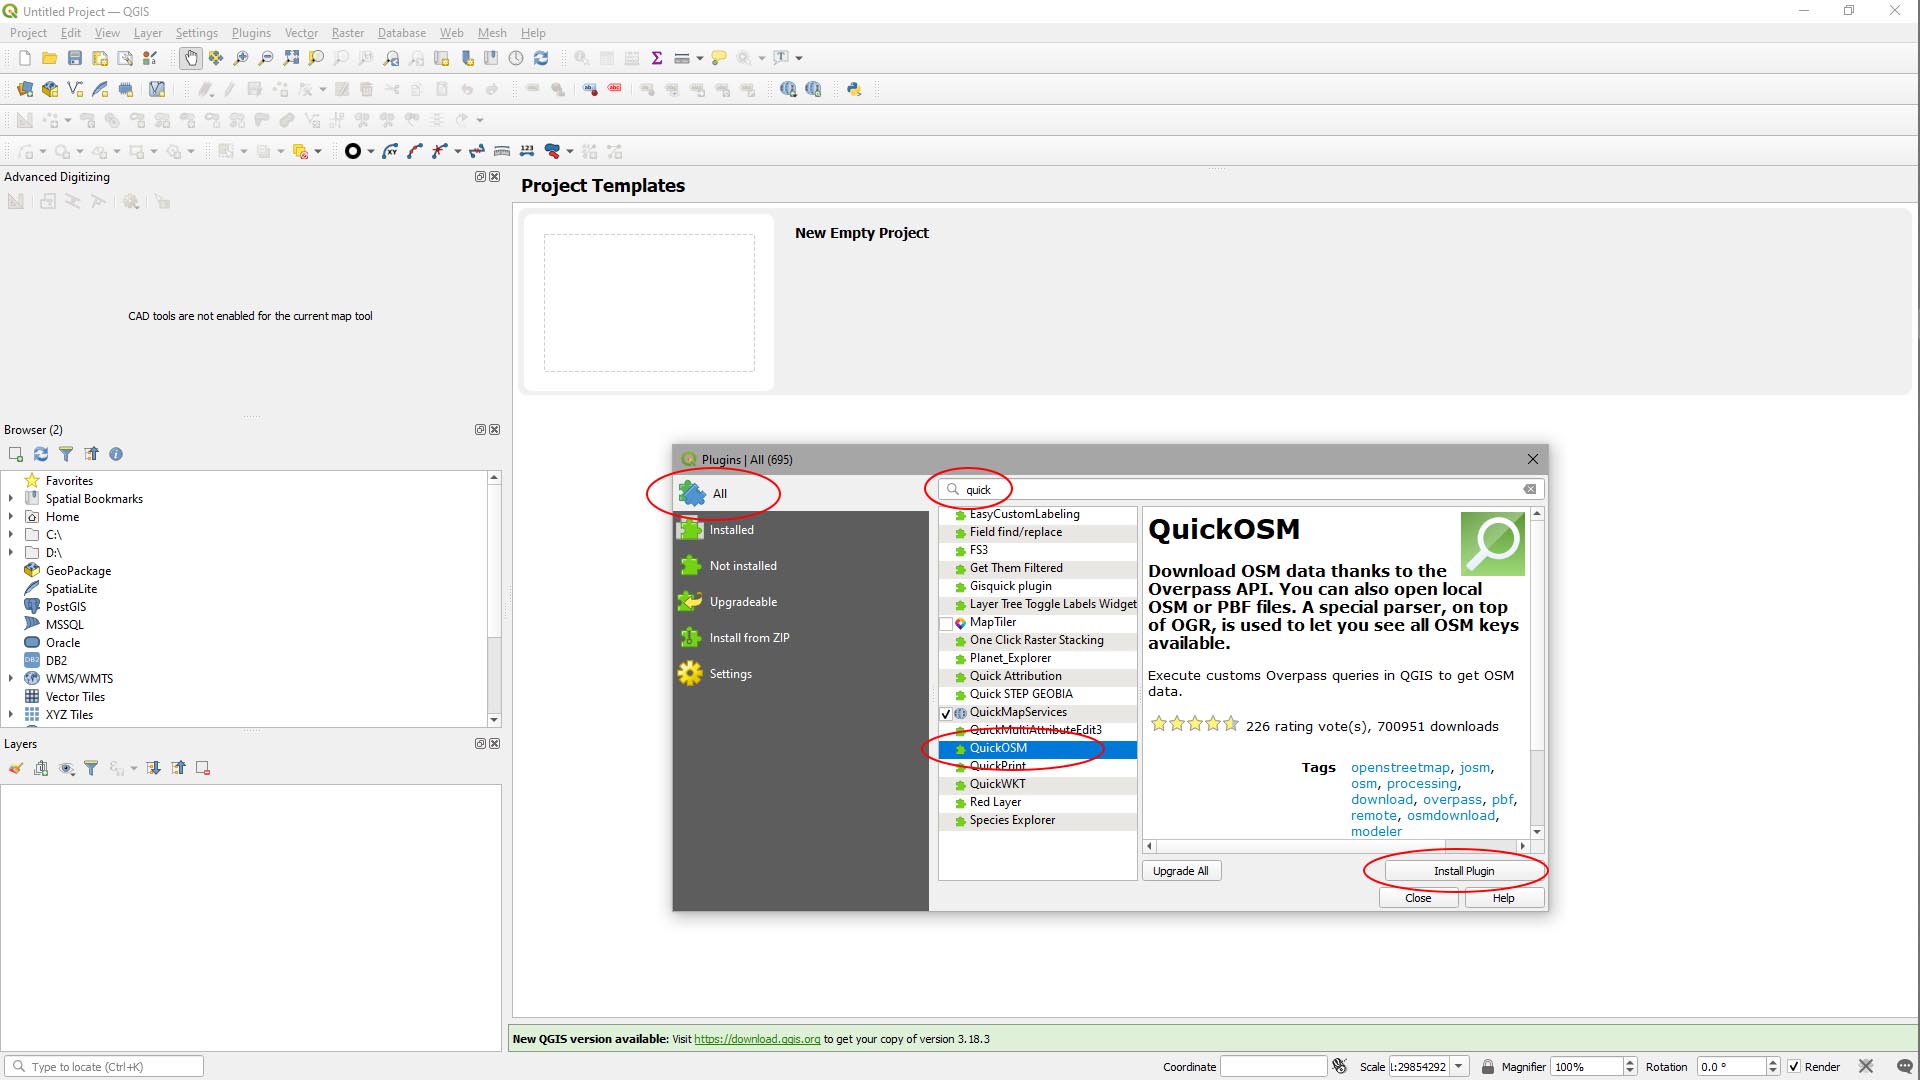
Step 2
- Repeat the above steps to install Quick OSM.
LOCATE YOUR AREA OF INTEREST
This is where Quick Map Services is really useful.
Step 1
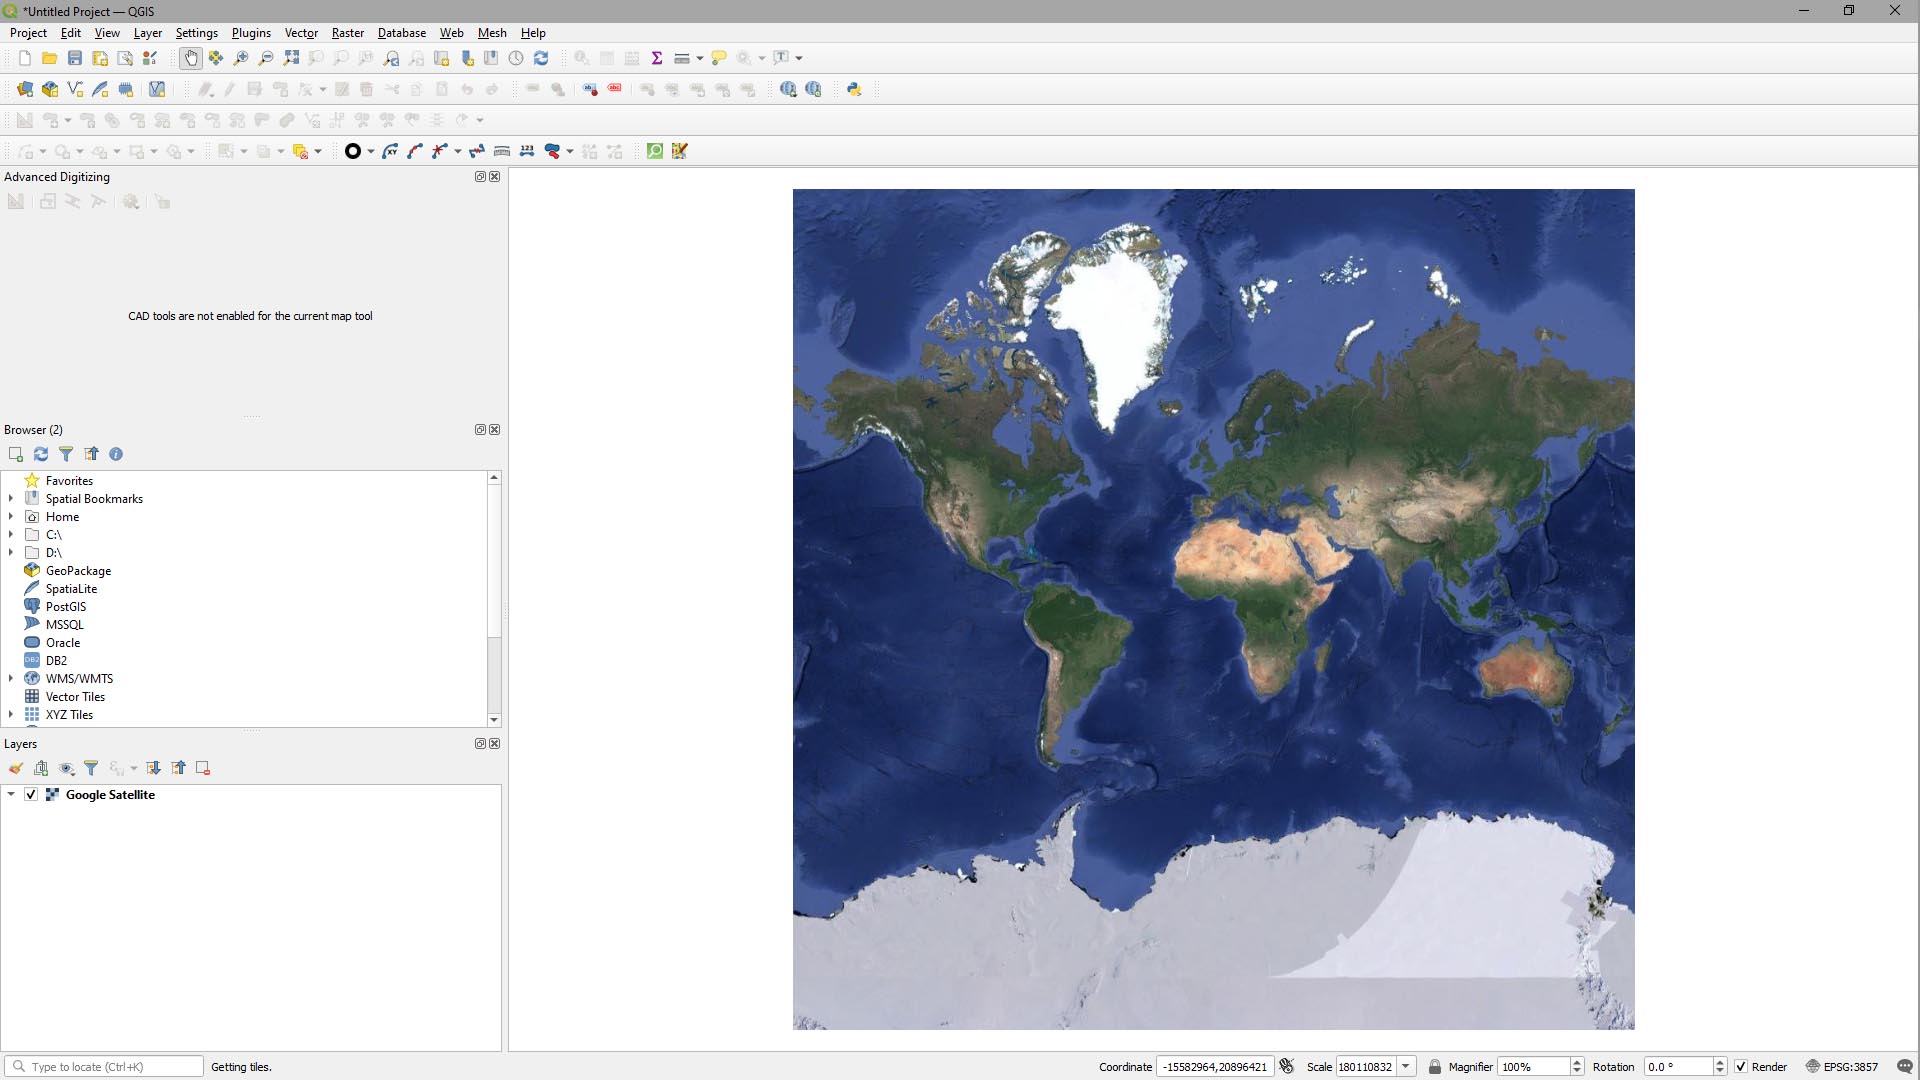
- On the main menu, click Web > QuickMapServices > Google > Google Satellite.
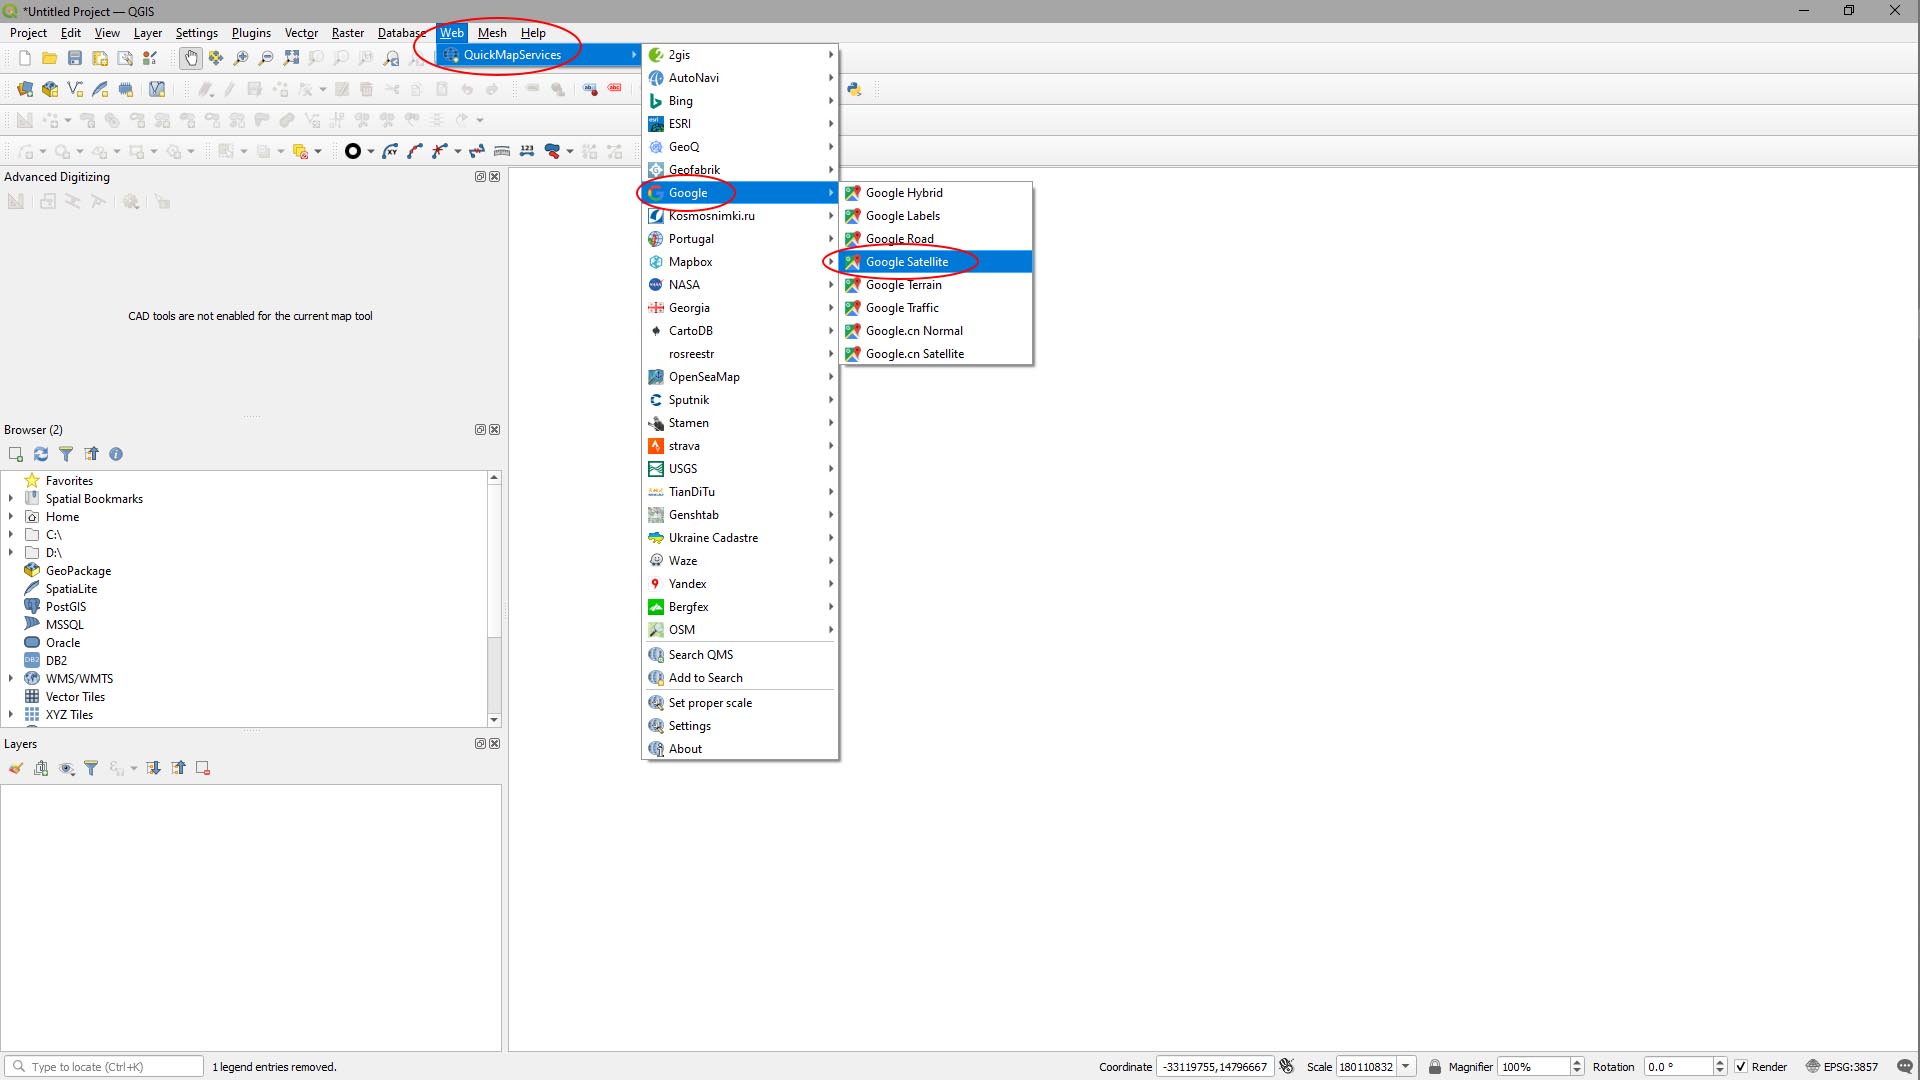
QGIS will load Google’s satellite imagery as a background image to your project.
Step 2
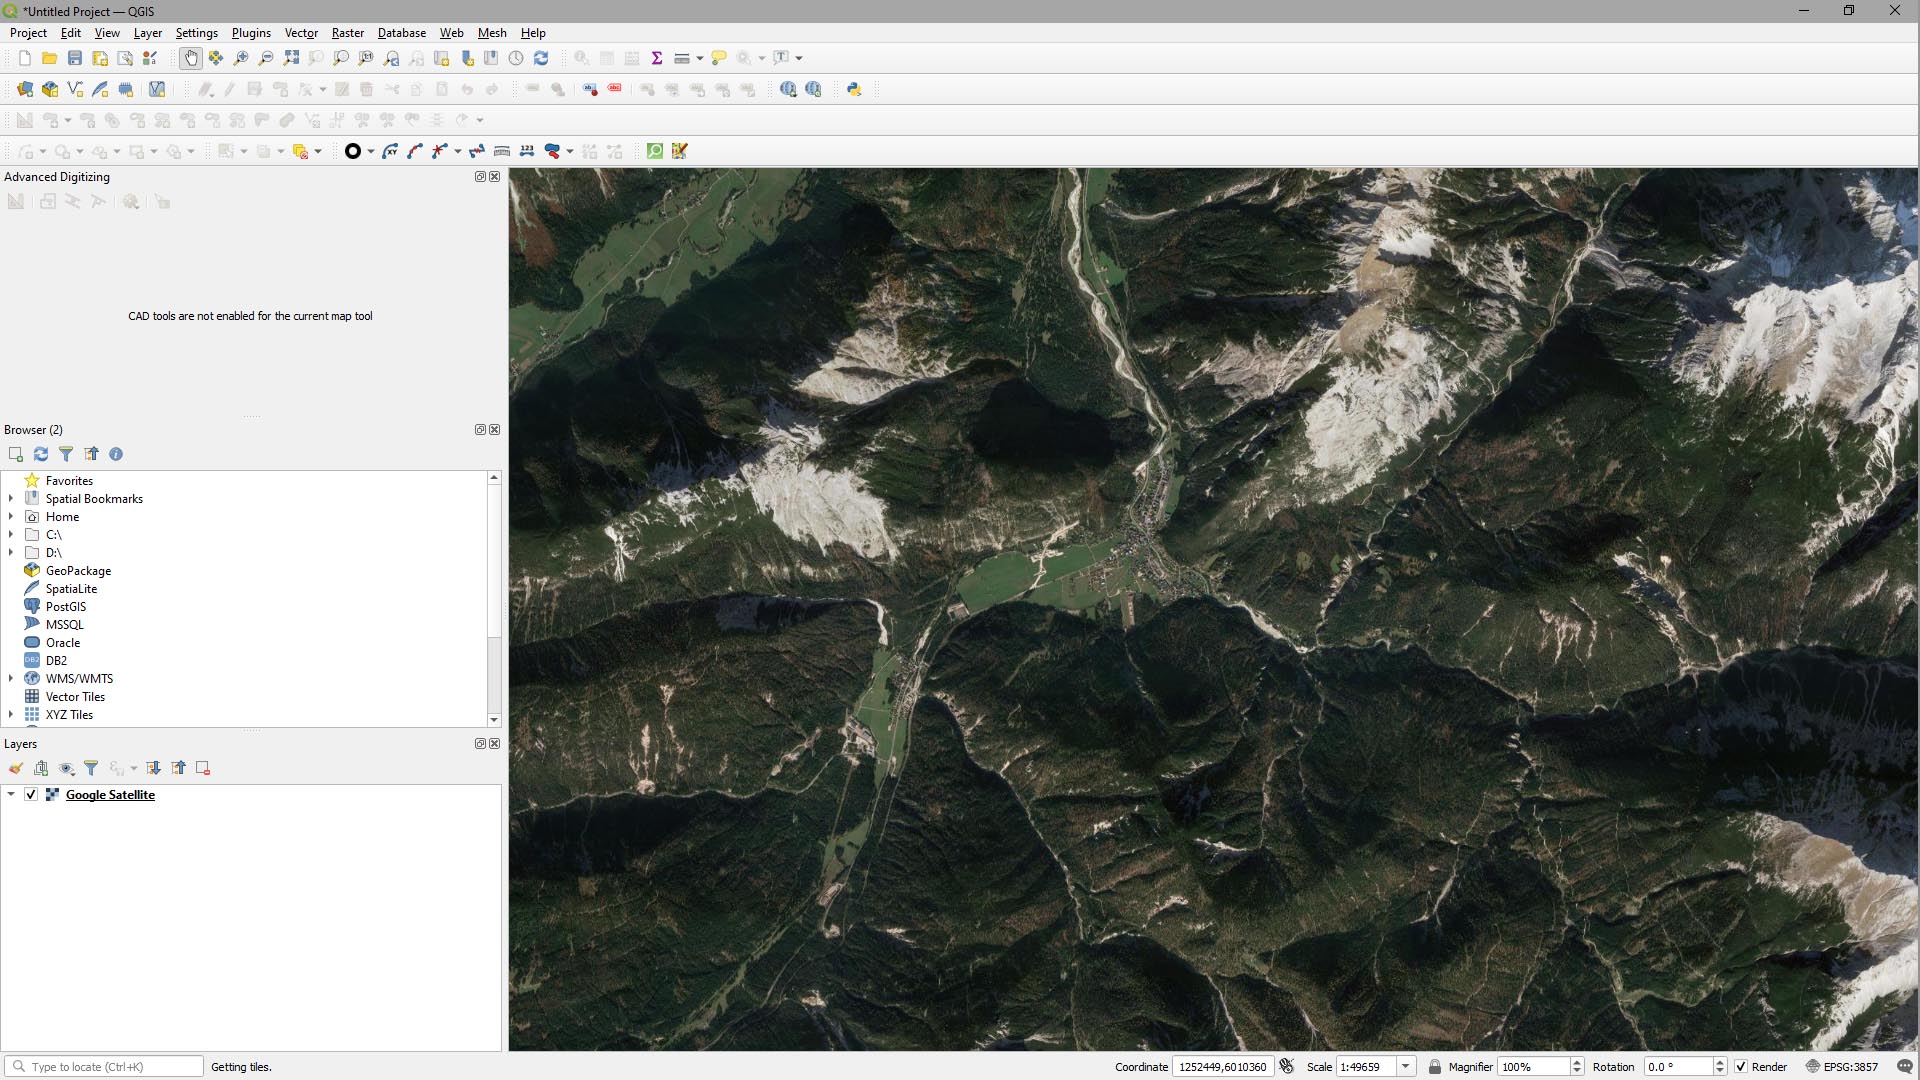
You can use this imagery to zoom in and navigate to the area you’re interested in (we’re going to work on a small town in the Austrian Alps called Scharnitz). Make sure that your viewport includes the entire area you want to create in UE4.
- On the main menu, click Web > QuickMapServices > Google > Google Satellite.
DOWNLOAD DATA
OSM includes lots of data that we don’t need. This is where we’ll use Quick OSM to grab only the data we want.
Step 1
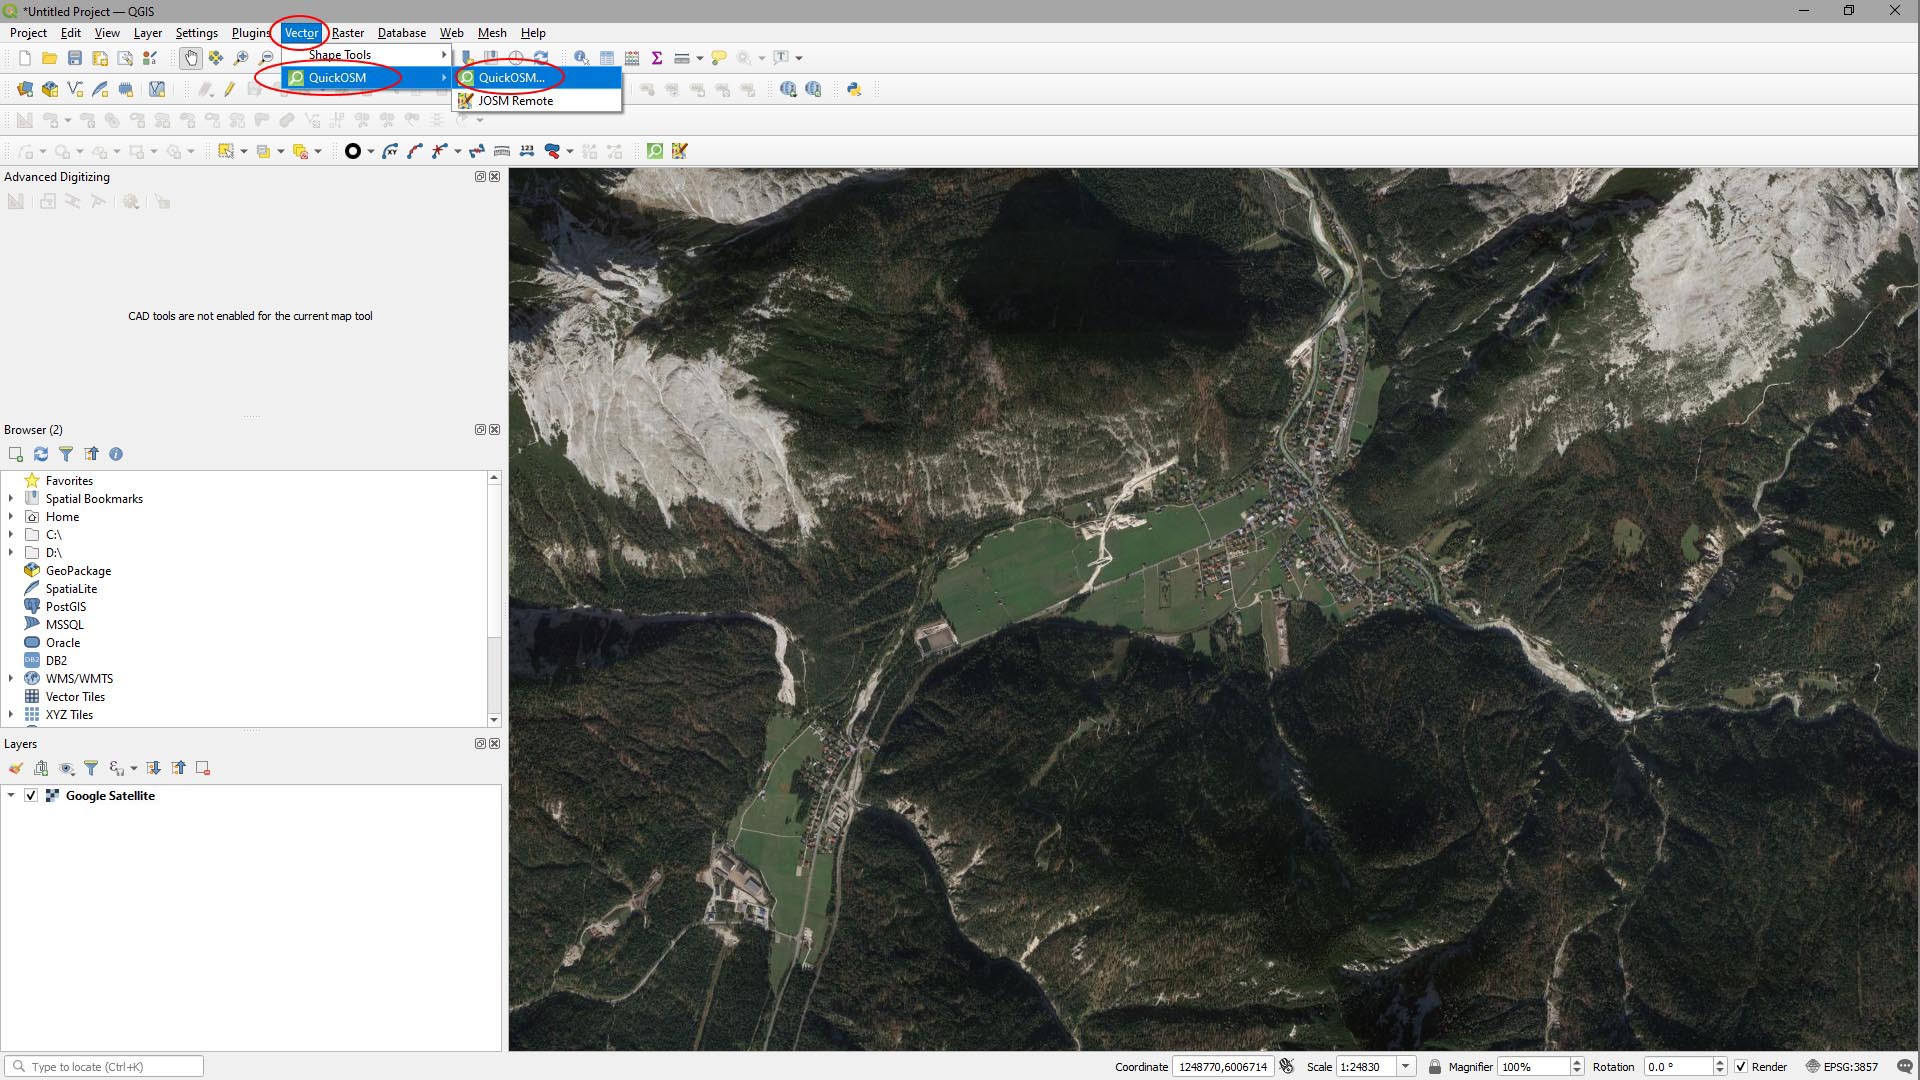
- On the main menu, click Vector > QuickOSM > QuickOSM….
Step 2
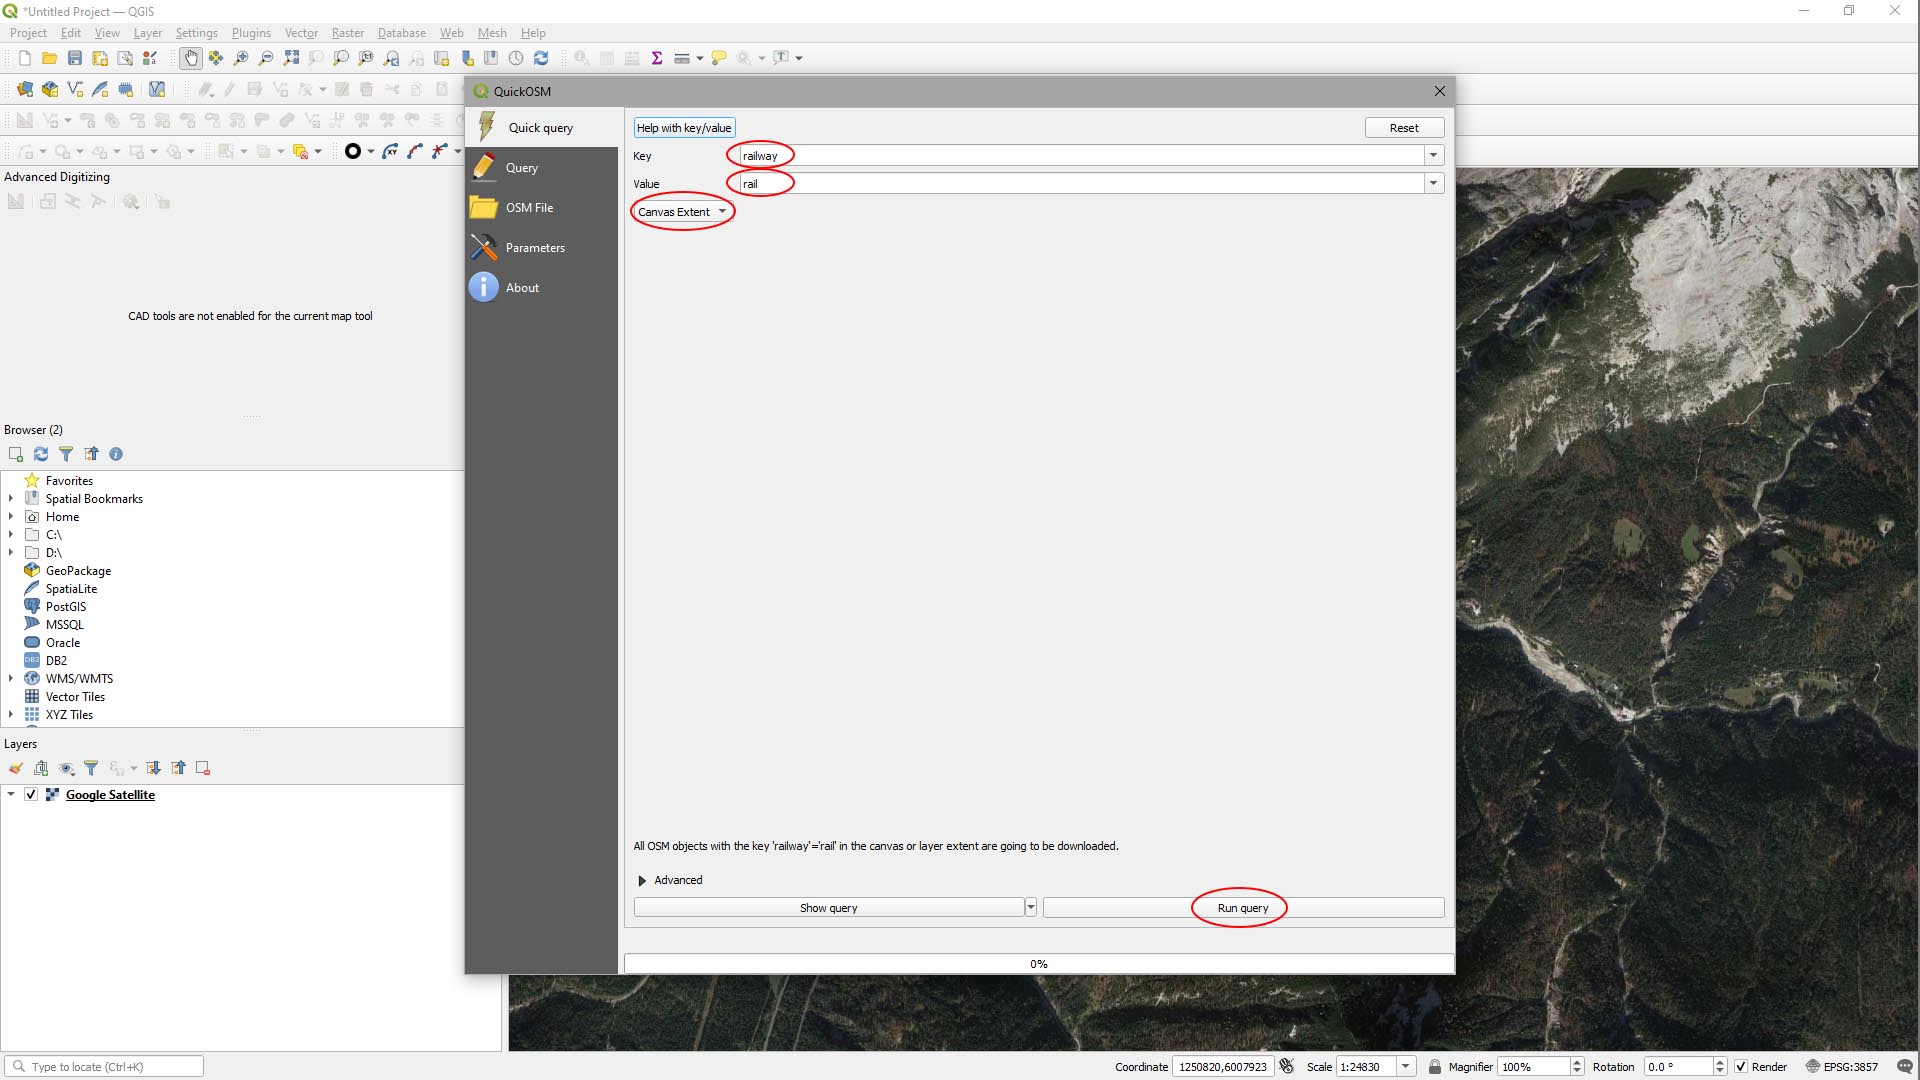
First we’ll grab the vector data for the railway lines.
- Click the In button, then select Canvas Extent from the drop-down list.
- Select Railway from the Key drop-down list.
- Select Rail from the Value drop-down.
- Then Run Query.
If data exists, a message will appear at the top of the plugin to tell you how many layers have been loaded. For our area, there were 2 layers. In the viewport it looks like this:
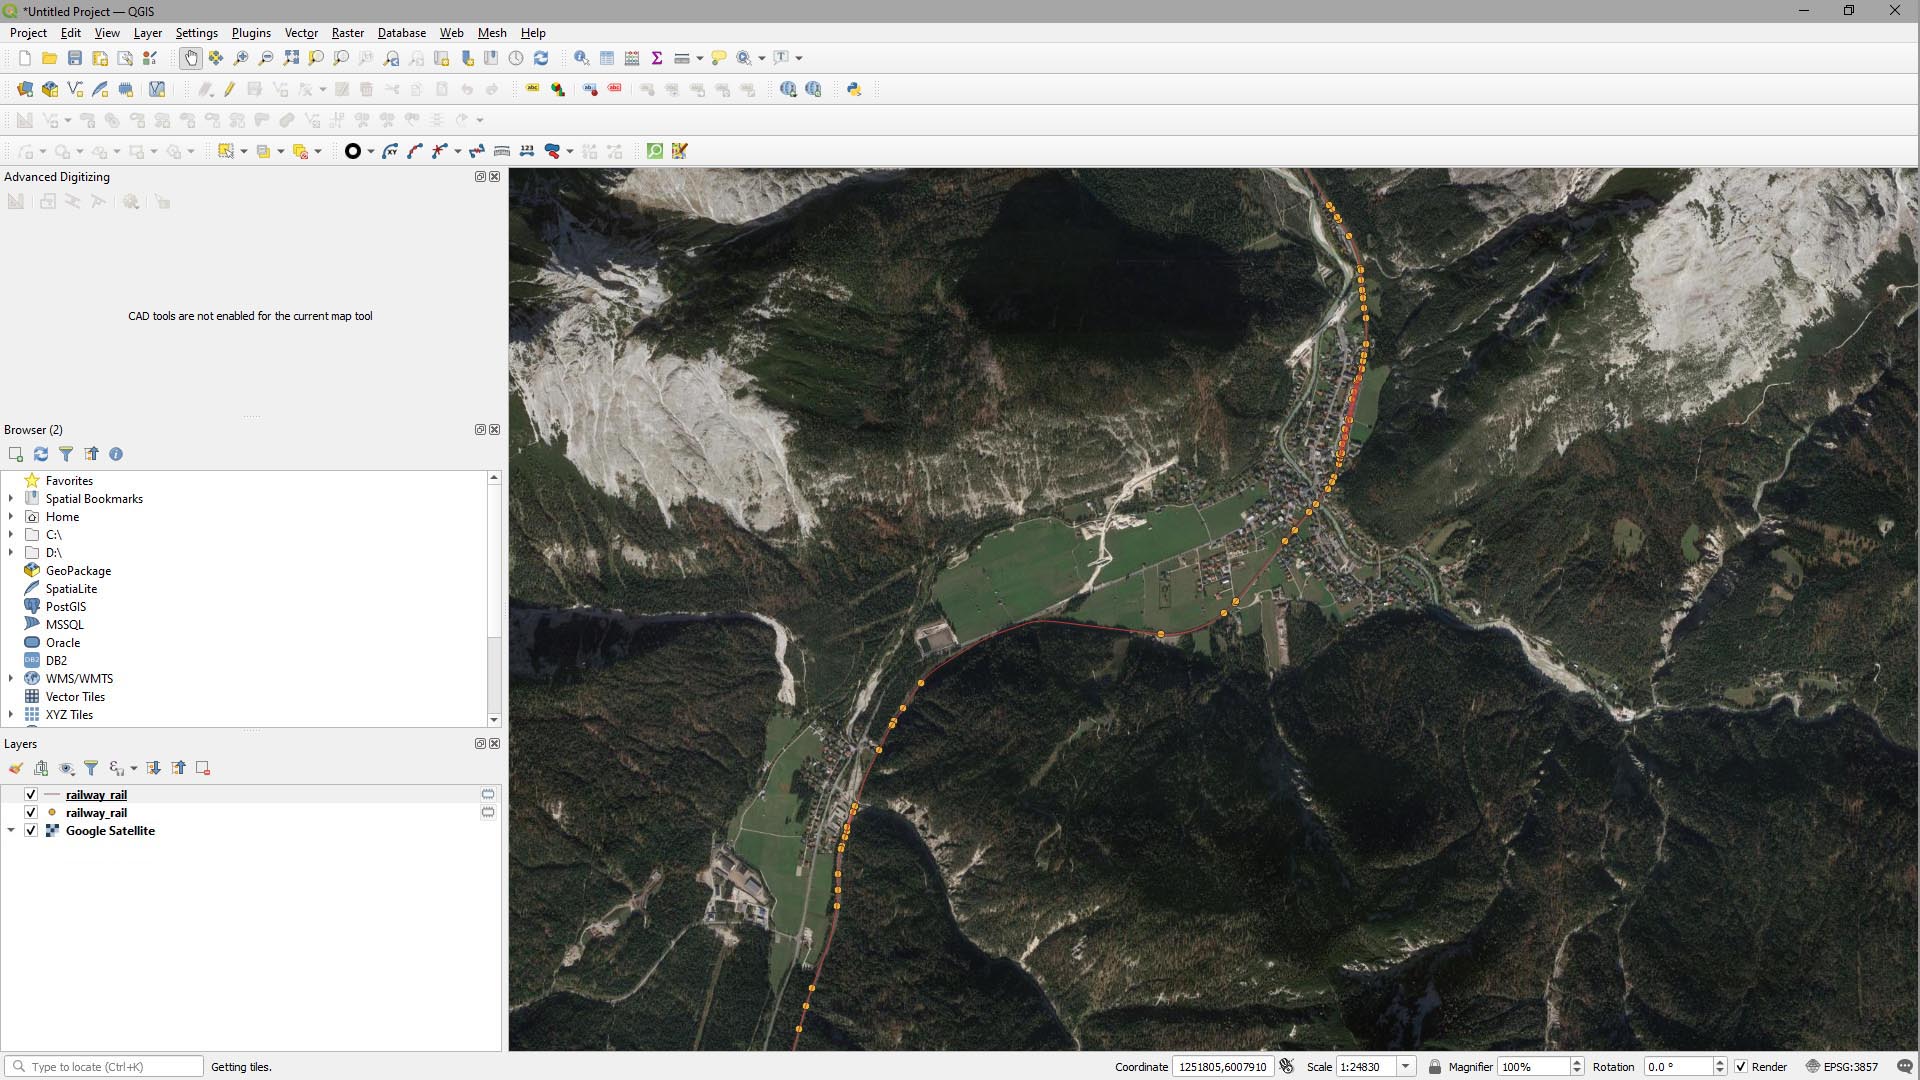
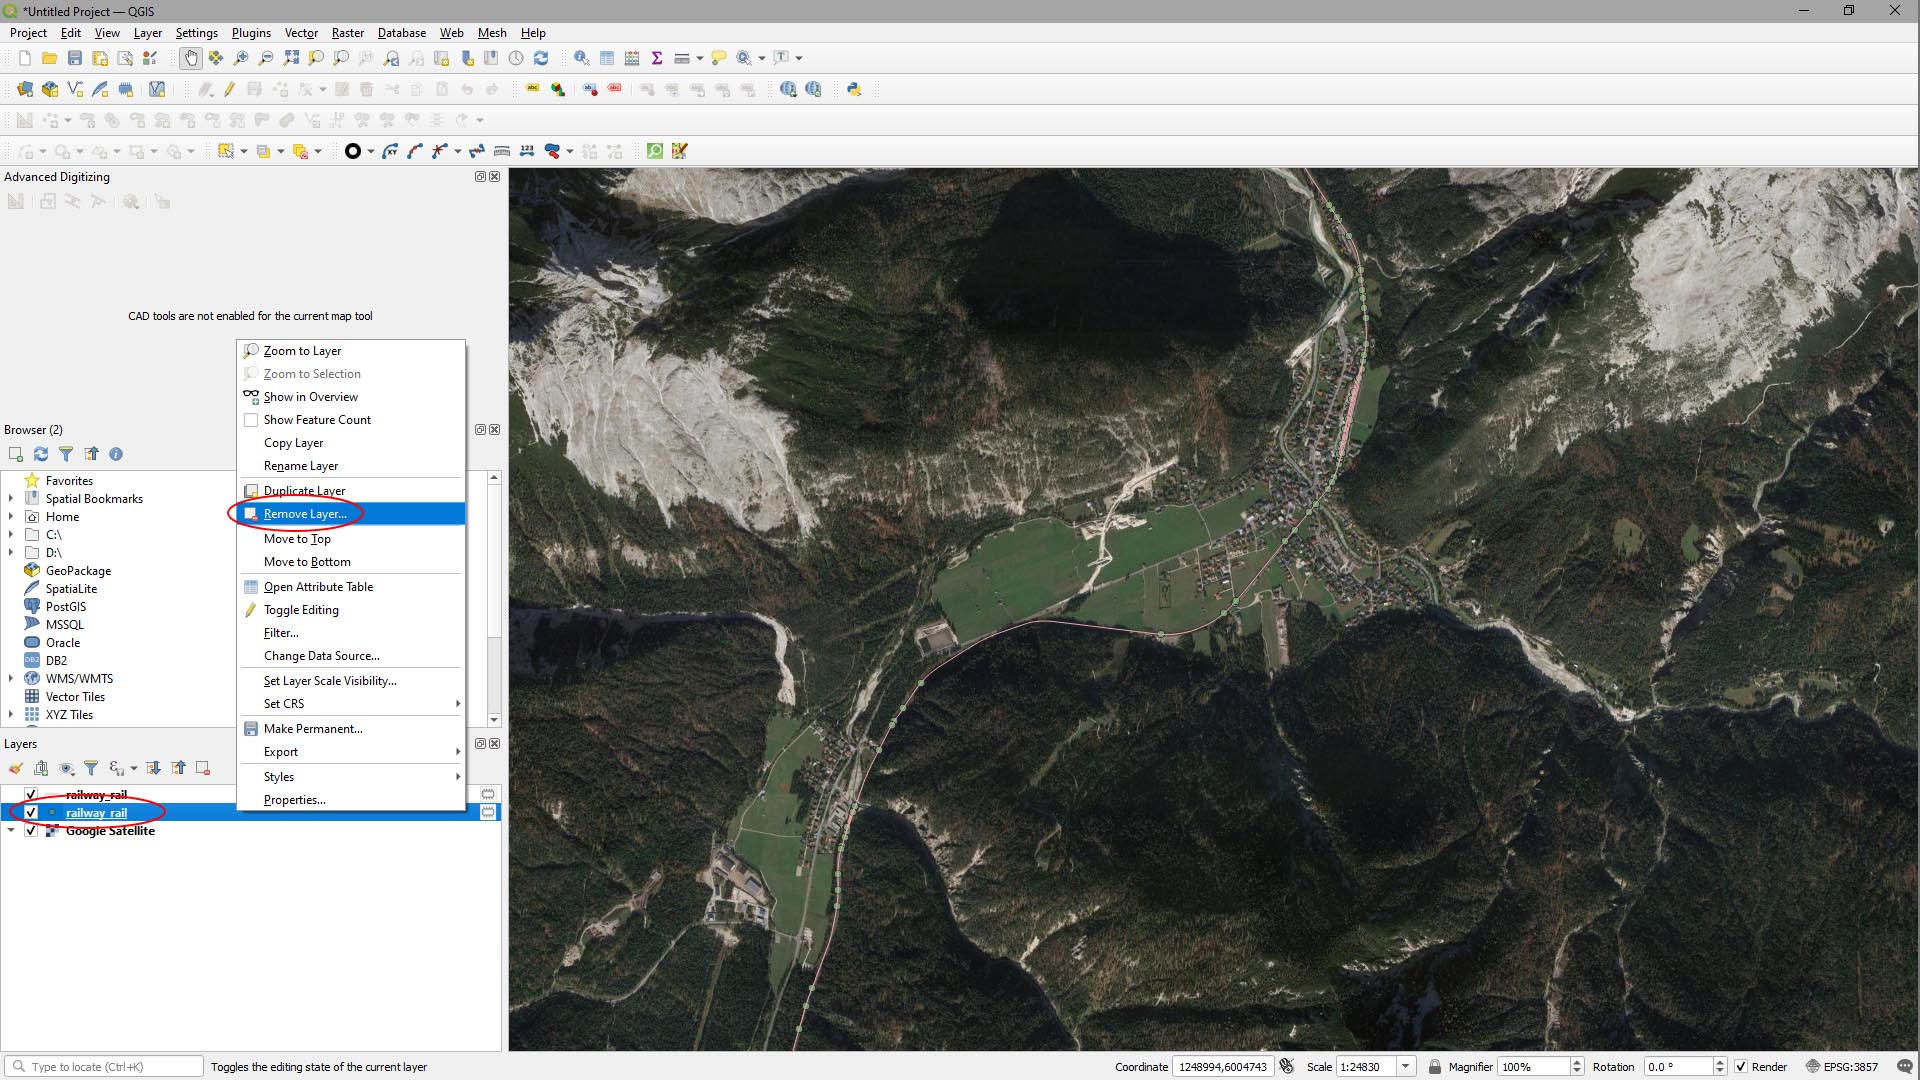
The two layers that were loaded were a layer with line vectors for the railway lines (we want that), and a layer with points. Since we already have the line, we can close that one.
- Right click on the railway_rail layer with the dot icon to the left and select Remove Layer
Step 3
Next we’ll grab the data for the roads:
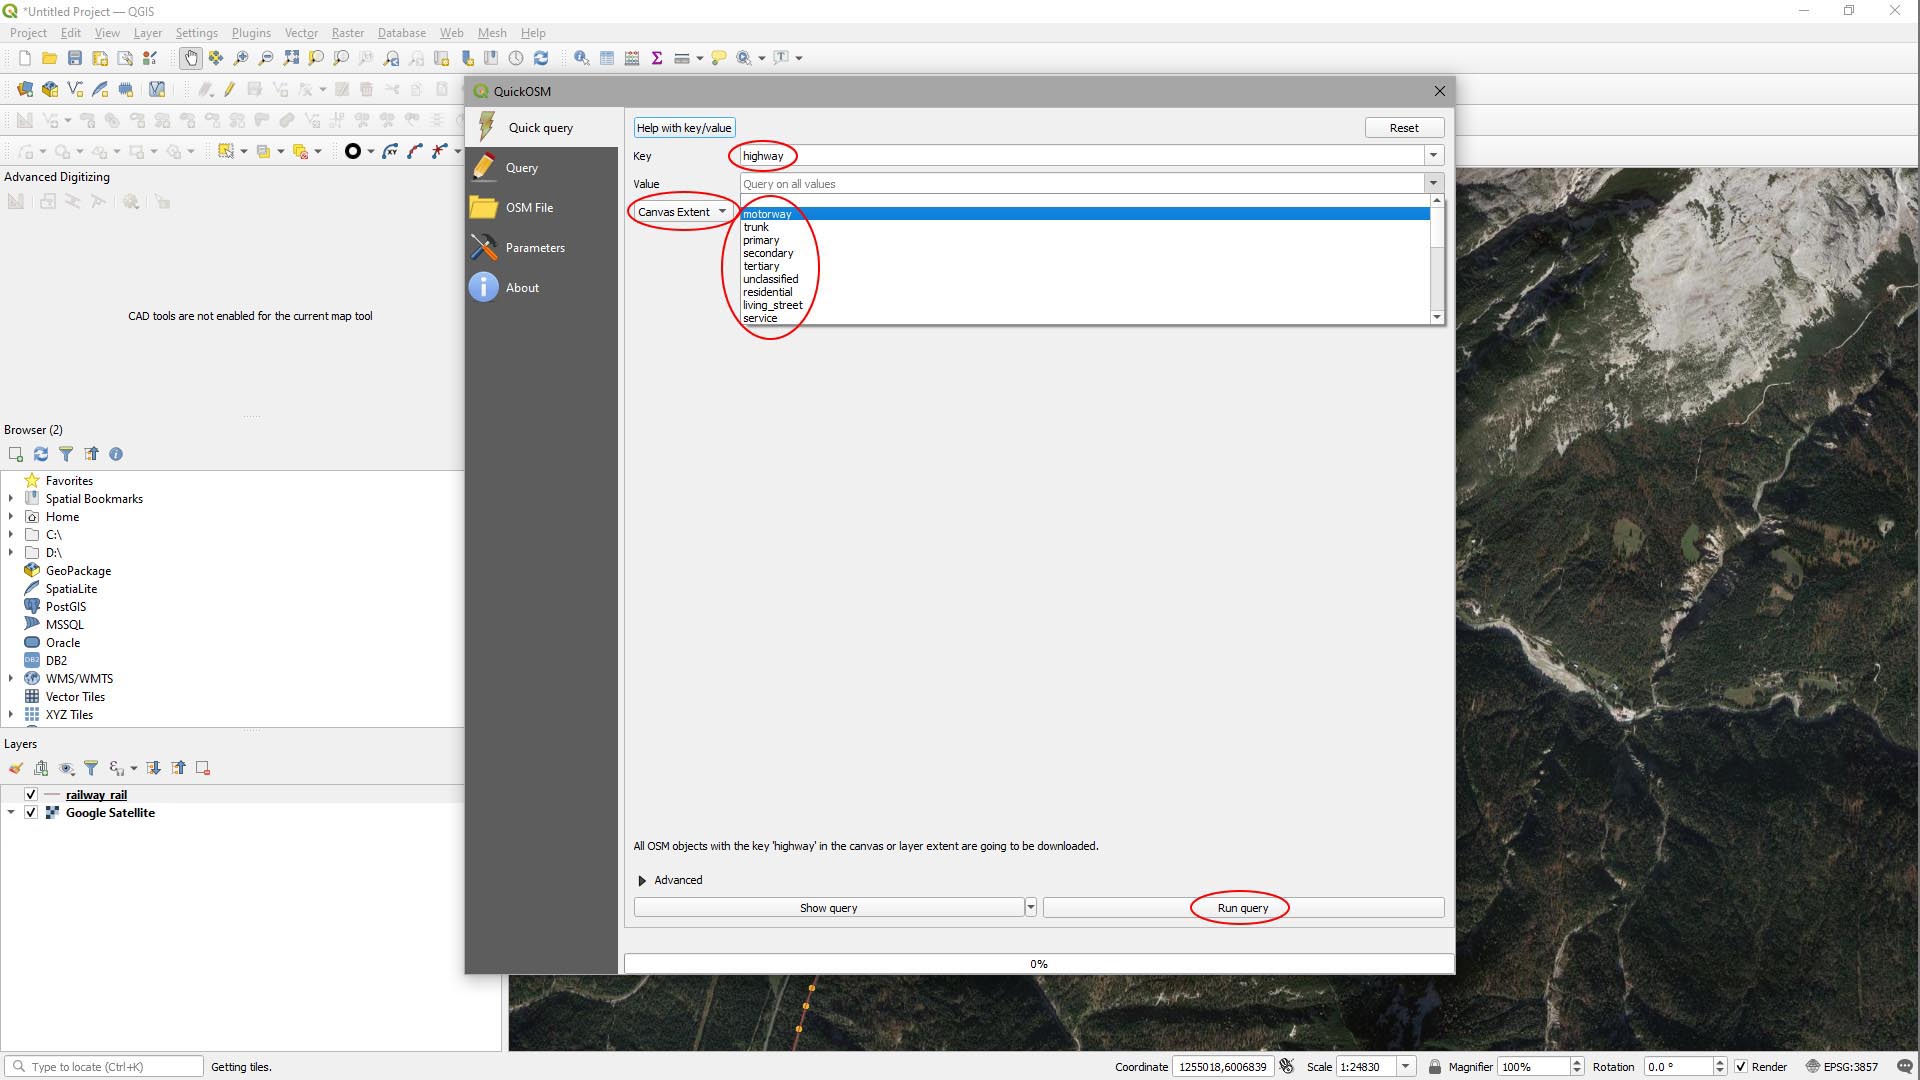
- Open the Quick OSM plugin interface again.
- Click the In button, then select Canvas Extent from the drop-down list.
- Select Highway from the Key drop-down list.
Roads are broken up into types, so this time there are a number of options we want. Selecting them individually means they’ll be loaded into QGIS as separate layers, which will make it easier to manage the data later. We’ll start with motorways:
- Select Motorway from the Value drop-down.
- Then Run Query.
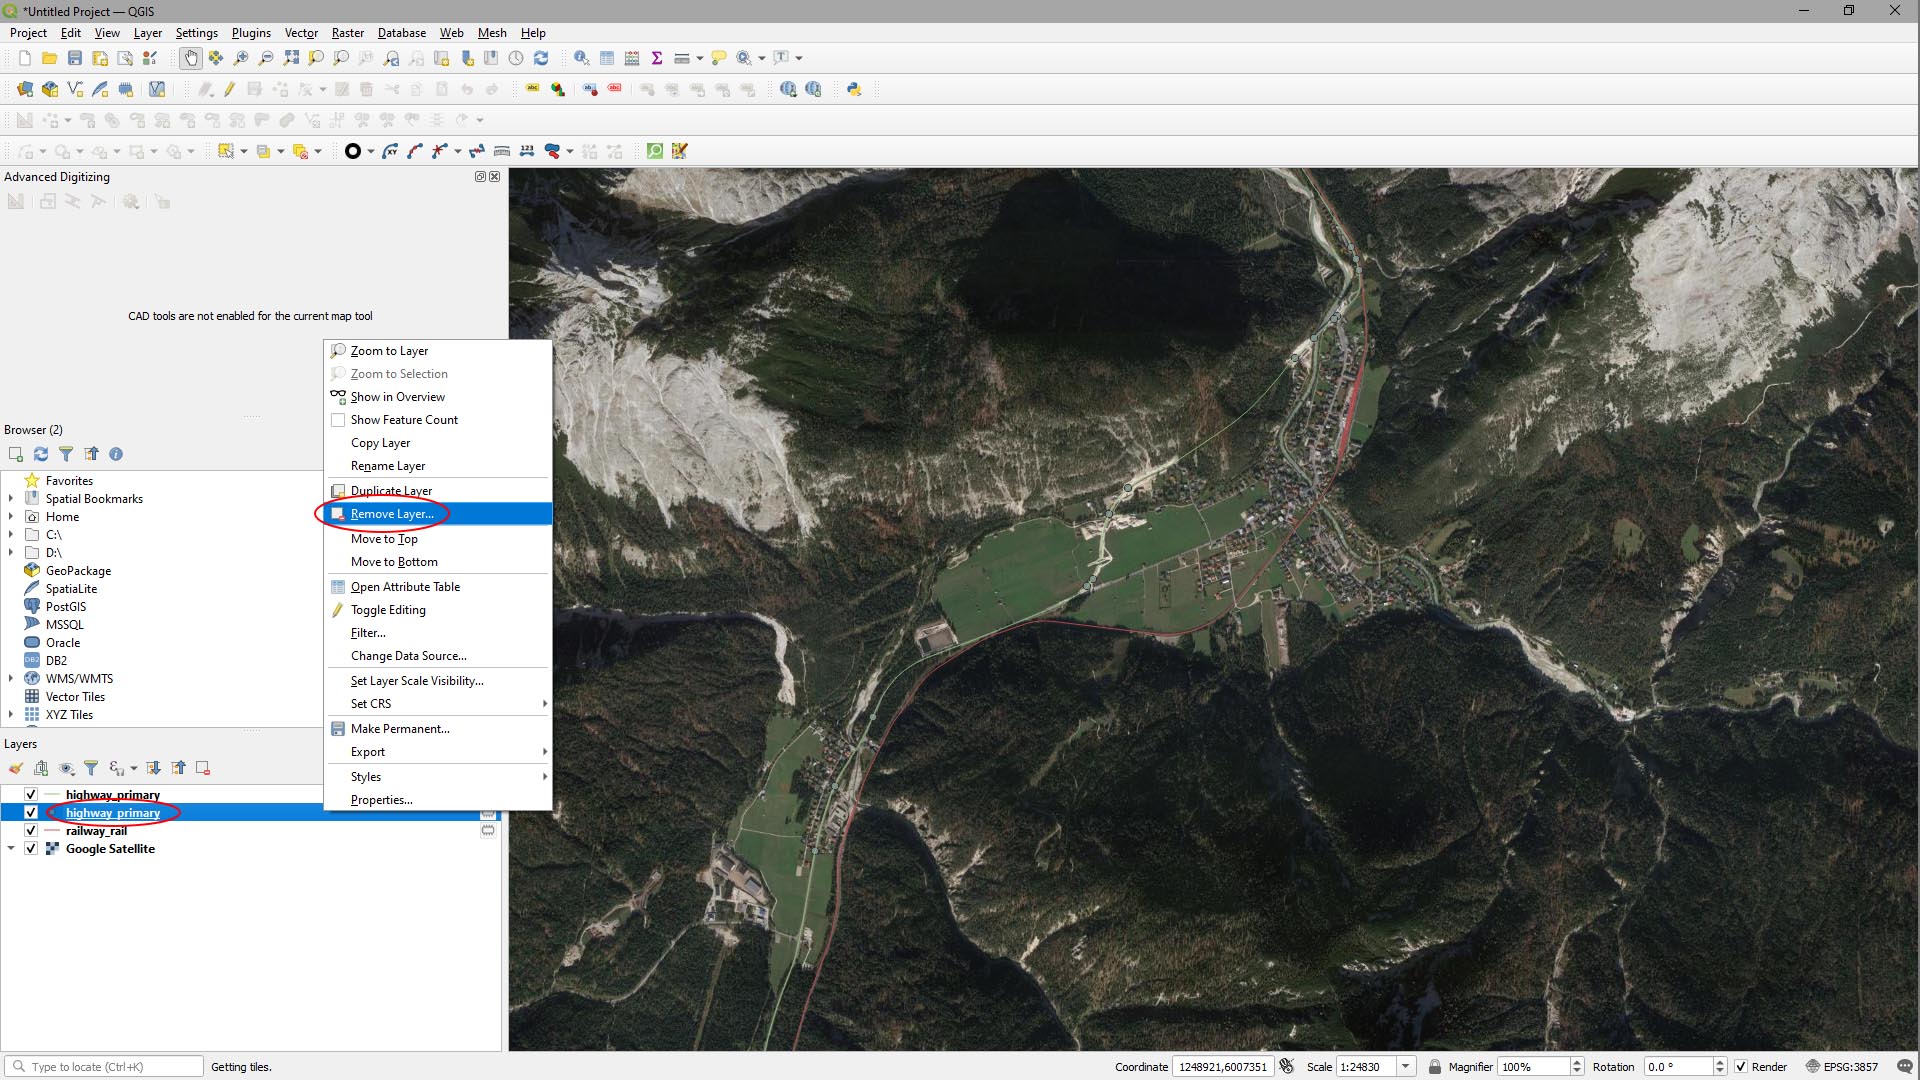
For our area we get the message ‘Successful query, but no result.‘, which means there are no motorways (/motorway data) in our AOI. ‘Trunk’ gives the same result, but for ‘Primary’, there is data available.
Again, for the Primary Highways, there are points and lines. We can close the points layer.
Step 4
Repeat the above for the remaining highways layers and any other vector data you want to use in your project. For our project in Scharnitz, Austria, we added the following vector layers to our project:
- Key: Railway; Value: Rail; Type: Line
- Key: Highway; Value: Primary; Type: Line
- Key: Highway; Value: Tertiary; Type: Line
- Key: Highway; Value: Residential; Type: Line
- Key: Highway; Value: Service; Type: Line
- Key: Power; Value: Line; Type: Line
- Key: Highway; Value: No value used – entire key added; Type: Polygon
- Key: Natural; Value: Water; Type: Polygon
Note that the Type mentioned above refers to the type of vector data we kept. We removed the other types in the Key/Value that weren’t required.
IMPORTANT
Vector data from OSM is digitised and classified into categories by individuals. There is room for interpretation of the guidelines to classification of OSM data, so it’s important to check all the values for a particular key (they may differ from area to area). It doesn’t take long to add all those you think you might need and you can remove any you don’t at a later stage very easily.
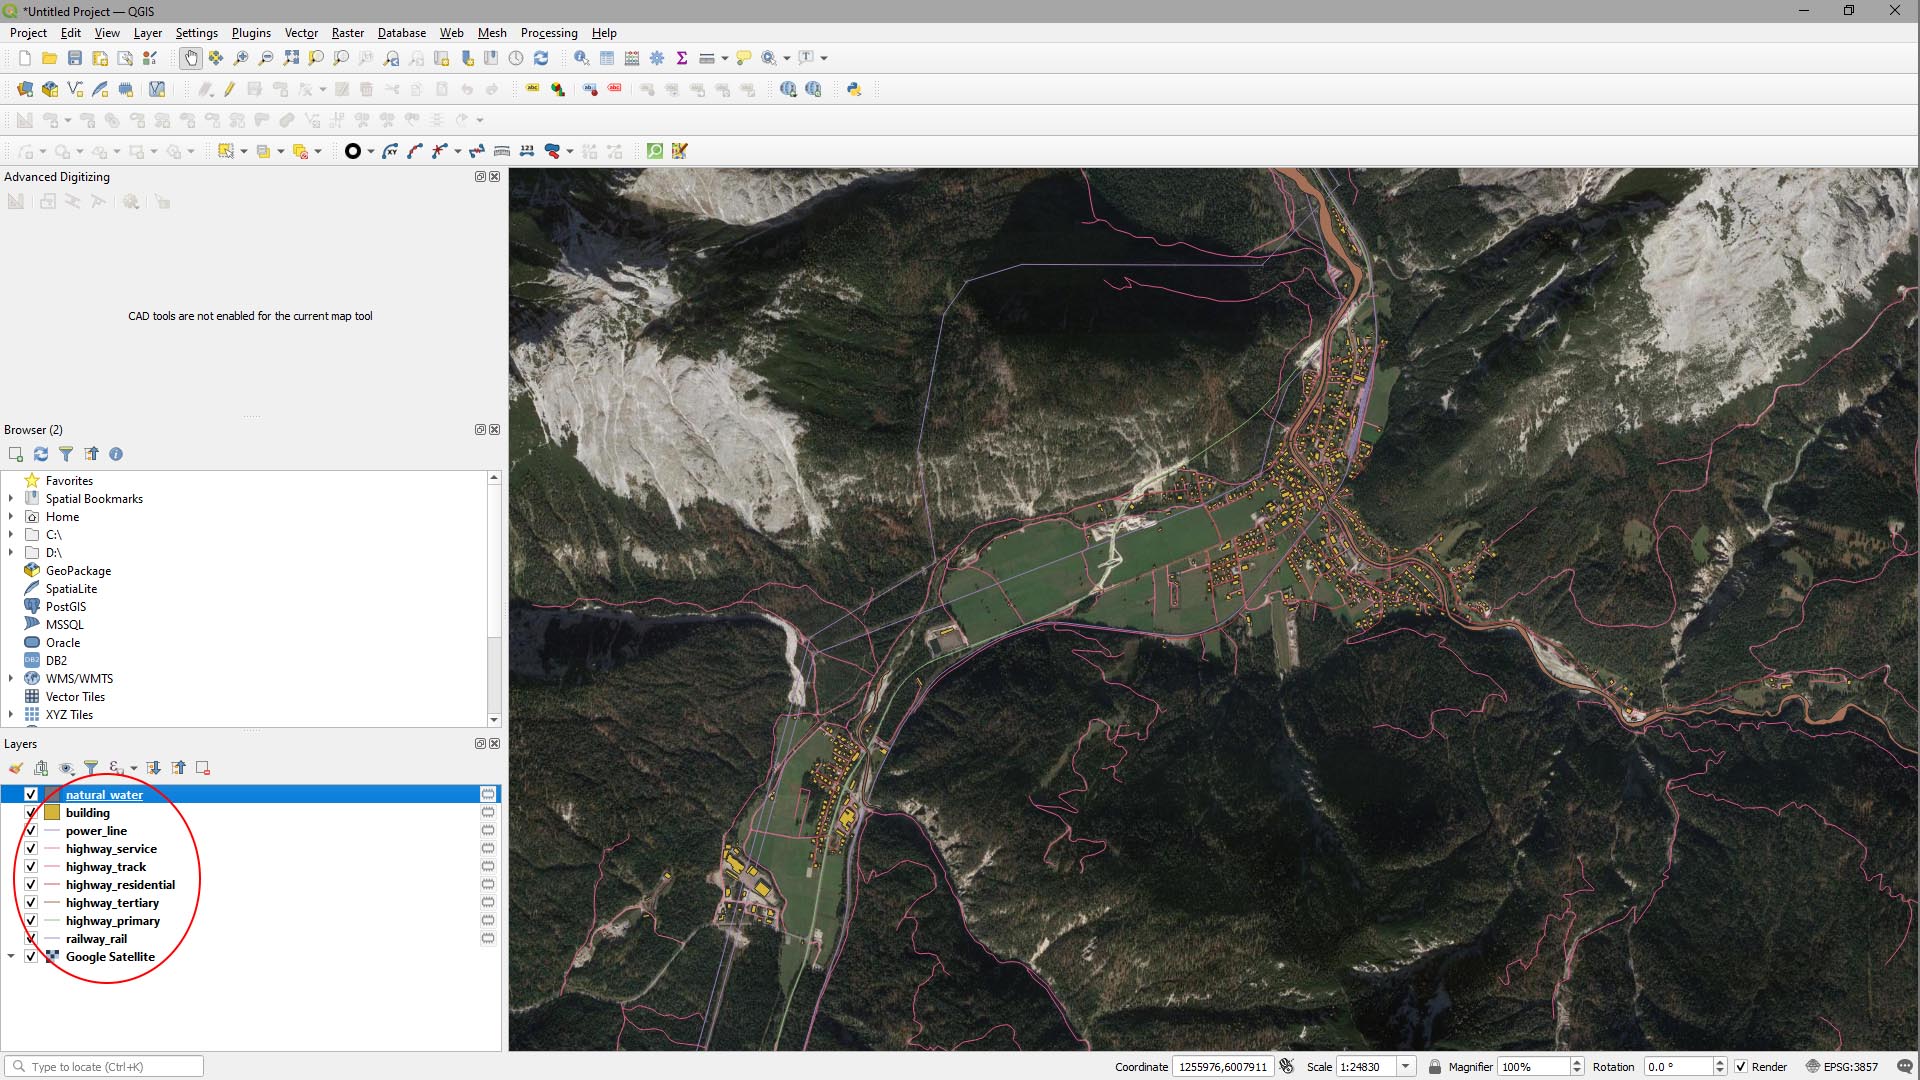
Here’s what it looks like with all the data loaded:
Step 5
Re-project, clip, edit and export the vector data layers. Here are step by step instructions, beginning with Re-Projecting & Clipping.